Main Business Dashboard
The Main Dashboard is your command center.
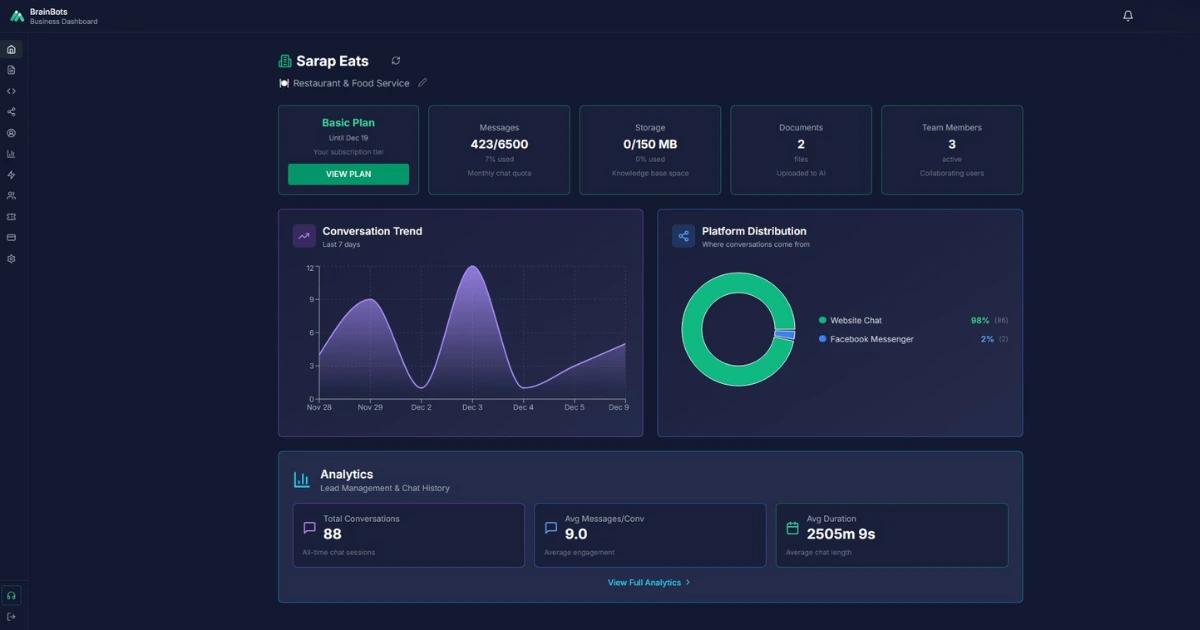
The Main Dashboard is your command center. It is the first screen you see when you log in, designed to give you a "pulse check" of your business. From here, you can track your onboarding progress, monitor your message usage, and see real-time performance statistics.
Located at the very top of the page, this section identifies your business and its configuration.
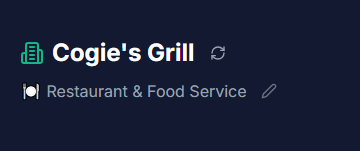
• Business Profile: Displays your registered business name.
• Industry Category: Shows your current industry (e.g., "🍽️ Restaurant & Food Service").
◦ Why this matters: BrainBots optimizes your AI's responses based on this industry setting.
◦ To Change Industry: Click the Pencil Icon (✏️) next to the industry name. You can select from 13 categories including Healthcare, Real Estate, Retail, and more.
• Refresh Data: Click the Circular Arrow (↻) to instantly update all stats and charts on the page.
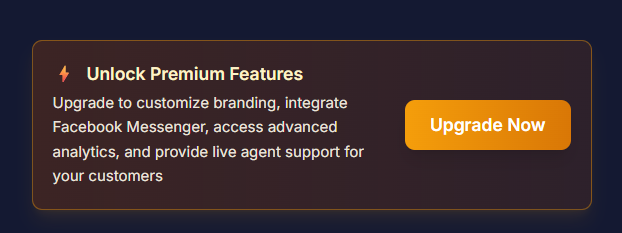
Note for Freemium/Trial Users: You may see an "Upgrade Banner" here. This is your shortcut to unlock premium features like custom branding and Facebook integration.
2. Onboarding Progress Tracker
Essential for new users.
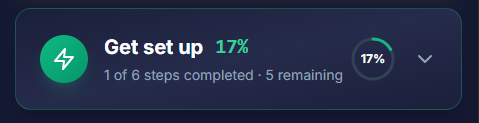
If you are new to BrainBots, you will see a checklist labeled "Setup Progress." This guides you through the 6 essential steps to get your bot running.
The 6 Setup Tasks:
1. Set Business Hours: Define when you are "Open" vs. "Closed" (2 mins).
2. Upload Knowledge Base: Train the AI with your PDFs or website (5 mins).
3. Configure Bot: Give your AI a name and personality (3 mins).
4. Customize Branding: Add your logo and colors (2 mins).
5. Connect Social Media: Link Facebook Messenger (5 mins).
6. Invite Team Members: Add agents for live chat support (2 mins).
• Tip: Once you complete all 6 steps (100%), this section automatically hides to give you more space.
• Toggle: You can click the header to expand or collapse this list at any time.
3. Quick Stats (At-a-Glance)
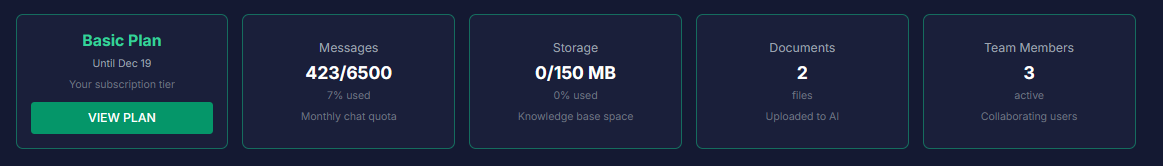
The top row of cards gives you an immediate view of your account health and resource consumption.
Card - What it tells you
Plan - Your current tier (Freemium, Basic, or Pro) and renewal date. Click "View Plan" to see feature details.
Messages - Your monthly "fuel." Shows how many messages you have used vs. your quota (e.g., 150/1,000).
Storage - Space used by your Knowledge Base documents.
Documents - Total number of files and URLs currently training your AI.
Team - Number of active agents helping you manage chats.
4. Analytics & Performance
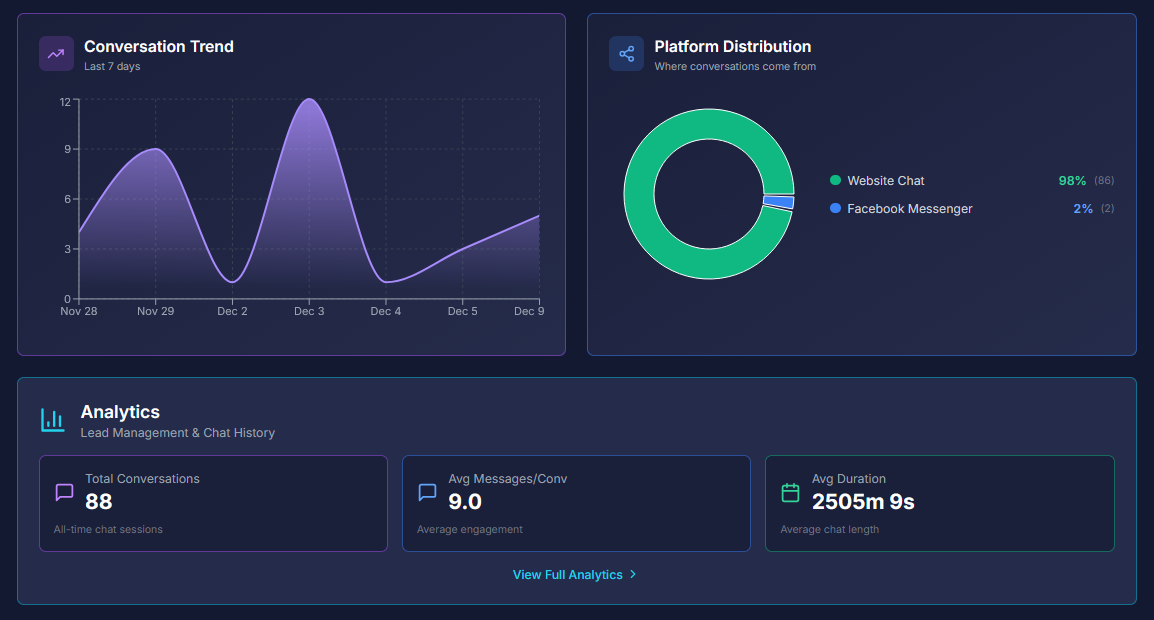
Available for Basic and Pro Plans.
If you are on a paid plan, the dashboard provides visual charts to help you understand your traffic.
• Conversation Trend: A graph showing how many people talked to your bot over the last 7 days.
• Platform Distribution: A donut chart showing where your customers are coming from (e.g., 60% Facebook, 40% Website).
• Summary Metrics:
◦ Total Conversations: All-time chat sessions.
◦ Avg Duration: How long customers spend chatting (e.g., "5m 30s").
Freemium Users: You will see a summary card here. To view detailed charts and graphs, you will need to upgrade.
5. Common Questions (FAQ)
Q: How do I refresh the data on my dashboard?
A: Click the refresh icon (↻) next to your business name in the header. Do not just refresh your browser; using this button ensures the latest data is pulled from the server.
Q: Why can't I see the Analytics charts?
A: Visual charts are exclusive to Basic and Pro plans. If you are on the Freemium plan, you will only see text summaries. Upgrading unlocks the full visual dashboard.
Q: What happens when I finish the Onboarding tasks?
A: The "Setup Progress" section will disappear to declutter your view. You can still access all those configurations (like Business Hours or Branding) via the left Sidebar Menu.
Q: When does my message quota reset?
A: Your "Messages" card shows your monthly cycle. The quota resets automatically at the start of your billing period. If you run out, you can buy "Add-on" packs in the Usage tab that never expire.