The Reports
The Reports tab is your property's analytics and financial performance center.
The Reports tab is your property's analytics and financial performance center. It provides deep insights into your booking trends, occupancy rates, and revenue streams to help you make informed business decisions.Here is a breakdown of how to navigate and read your reports:
1. Date Range Filtering
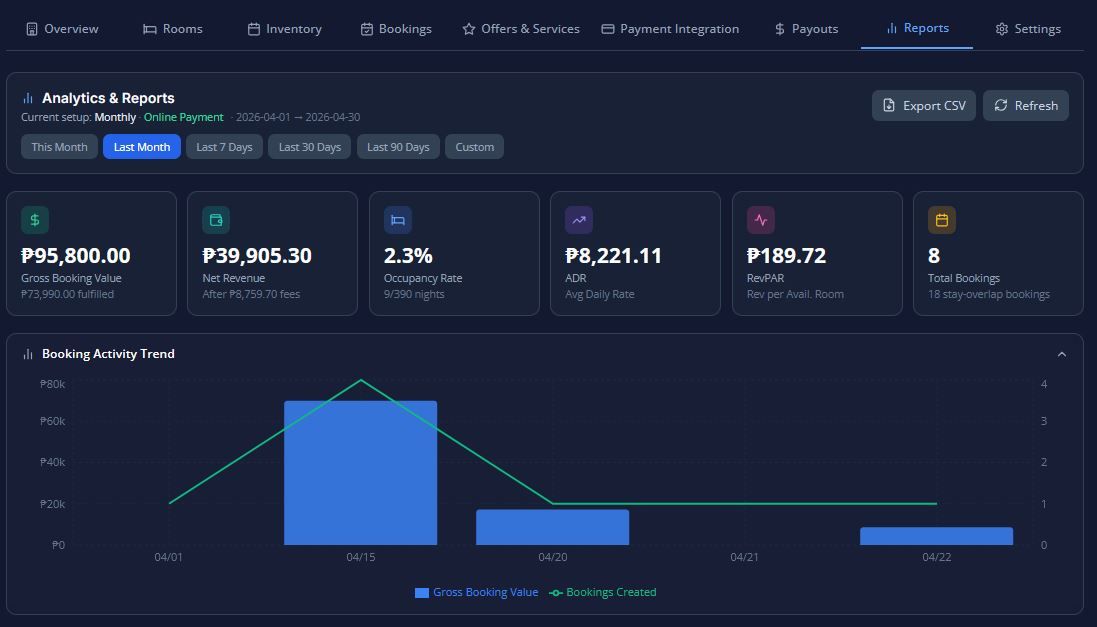
At the top of the Reports tab, you can filter all the data by specific timeframes. You can select a Custom range (by picking exact "From" and "To" dates) or use one of the convenient presets:
- This month
- Last month
- Last 7 daysLast 30 days
- Last 90 days
2. Occupancy & Room Performance
These sections help you understand how well your rooms are selling:
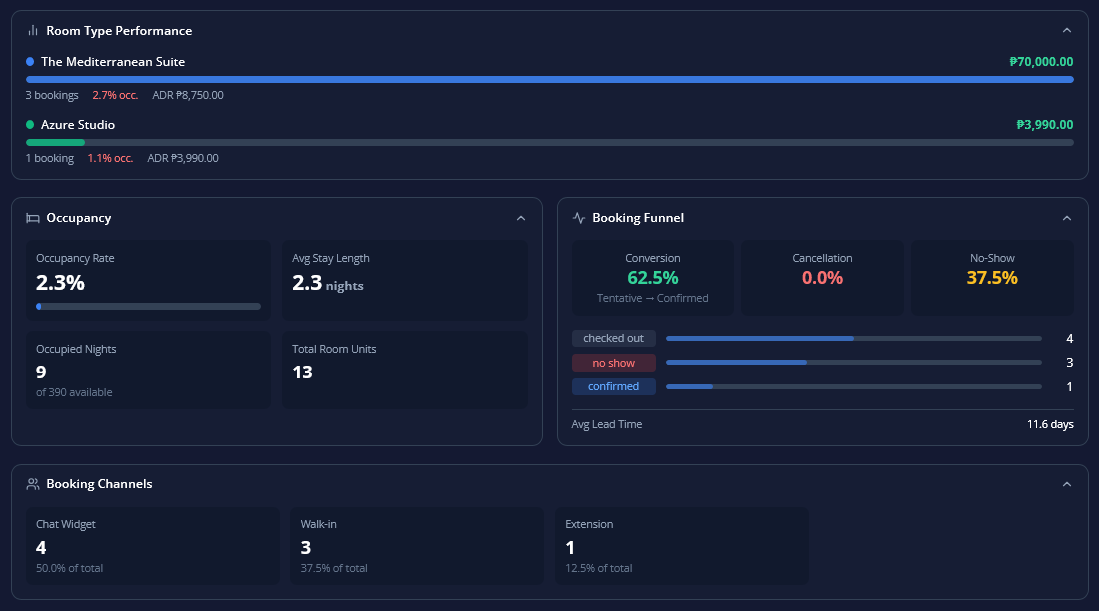
- Occupancy Report: Displays your overall Occupancy Rate (%), Average Length of Stay (in nights), the ratio of Occupied Nights vs. Total Available Nights, and your Total Room Units.
- Room Type Performance: A detailed table comparing your different room types based on Bookings Count, Revenue generated, Occupancy Percentage, and Average Daily Rate (ADR).
3. Booking Funnel & Channels
These reports show you where your guests are coming from and how they behave:
- Booking Funnel: Tracks your guest conversion journey. It shows the Conversion Rate (percentage of tentative/pending bookings that became confirmed), Cancellation Rate, No-Show Rate, Average Lead Time (how many days in advance guests book), and a bar chart of bookings by status.
- Booking Channels: Breaks down your bookings by source (e.g., widget, chat, dashboard, messenger, walk-in) and shows the percentage of your total bookings that each channel brings in.
4. Financial & Payment Analytics
Depending on your configured booking mode, you will see specific financial reports:
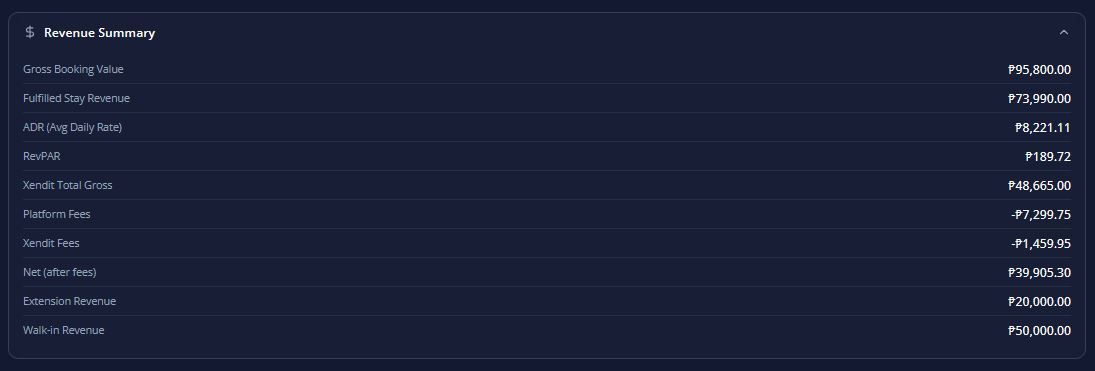
- Revenue Summary: Your master financial snapshot. It tracks Gross Revenue, ADR, RevPAR (Revenue Per Available Room), collected deposits and balances, outstanding balances, net online revenue, and revenue specifically from extensions and walk-ins.
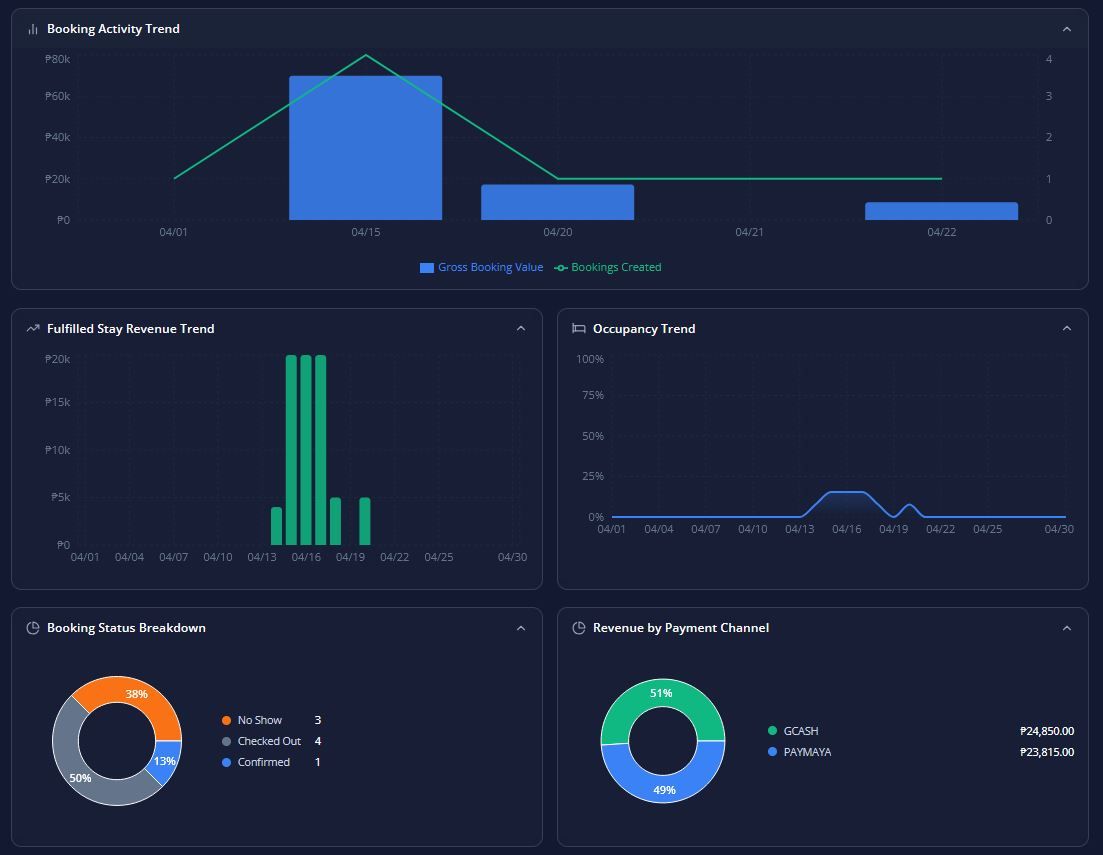
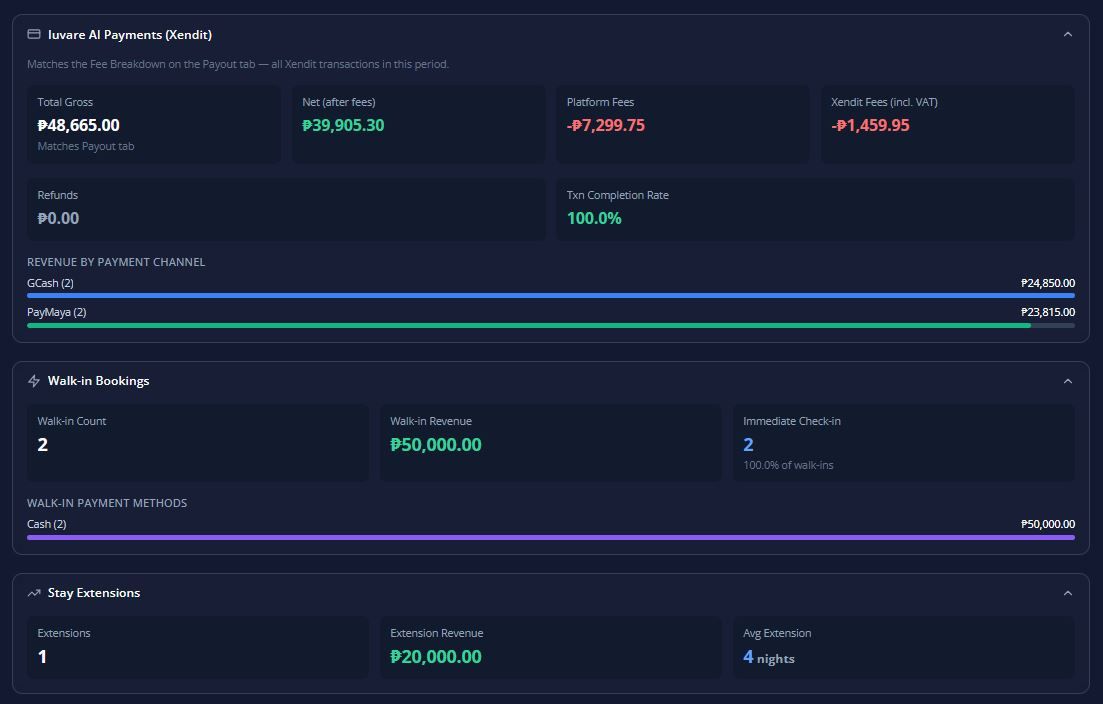
- Online Payment Revenue (For Online Payment Mode): If you process payments via Xendit, this shows your Total Gross Revenue, Net Revenue, Platform Fees, Xendit Processing Fees (with VAT), Refund Amounts, Transaction Completion Rate (%), and a breakdown of revenue by payment channel (e.g., GCash, Maya, cards).
- Reservation & Payment Report (For Reservation-Only Mode): If you collect manual payments, this tracks Deposits Collected, Balances Collected, Balances Due on Arrival, Gross Revenue, Deposit Percentage Distribution, Average Confirmation Lag (time between a tentative request and your confirmation), and lost revenue from expired tentative bookings.
5. Specialty Reports
To help you track specific operational scenarios, the dashboard includes:
- Walk-In Bookings Report: Tracks total walk-in counts, revenue generated, immediate check-in percentages, and the payment methods used for walk-ins.
- Extensions Report: Tracks the total count of stay extensions, the revenue they generated, and the average number of nights guests extend their stays.
6. Visual Charts
Throughout the Reports tab, data is also presented in easy-to-read visual charts, including:
- Revenue Trend (over time)
- Occupancy Trend (over time)
- Booking Status (Donut chart)
- Room Type Revenue (comparison)
- Payment Method Breakdown